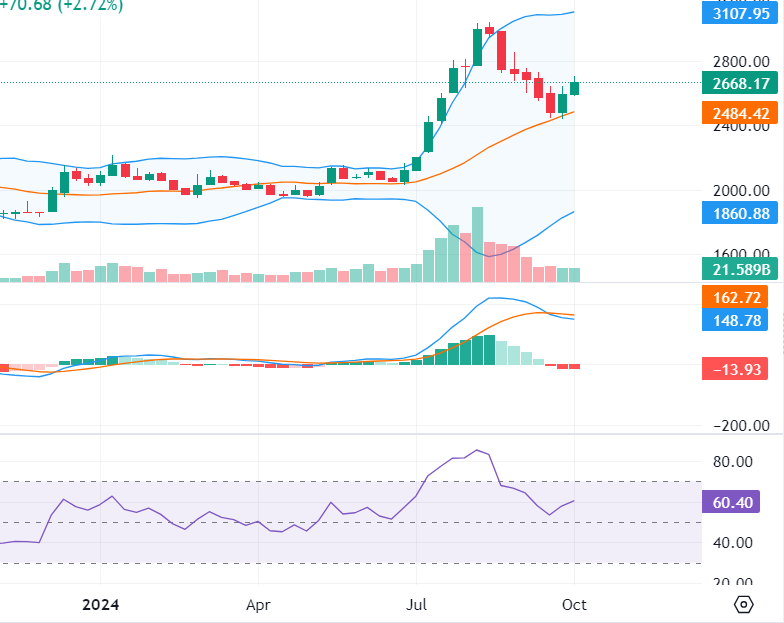
What is Bull market ? Stock Market of Nepal Point to 3000 can be wave 1 and current correction is wave 2
Oct Mon 2024 02:36:44
626 views

Kathmandu. The stock market of Nepal before Dashain, there were 4 days of trading in the market. In four days of trading, the market fell only for 1 day and increased for 3 days. The market which closed at the point of 2597 last week closed at the point of 2668.17 this week. This week, the stock market closed with an increase of 70.68 points. The previous week, the market closed with an increase of 110.73 points. 21 billion 16 million was traded in 4 days of the week. Last week, there was a turnover of 22 billion 16 million in the market. This week, the average daily turnover is 5 billion 29 million. This transaction was worth 5 billion 54 million in the previous week.
Kathmandu. In the week before Dashain, there were 4 days of trading in the stock market. In four days of trading, the market fell for only 1 day and increased for 3 days. The market which closed at the point of 2597 last week closed at the point of 2668.17 this week. This week, the stock market closed with an increase of 70.68 points. The previous week, the market closed with an increase of 110.73 points. 21 billion 16 million was traded in 4 days of the week. Last week, there was a turnover of 22 billion 16 million in the market. This week, the average daily turnover is 5 billion 29 million. This transaction was worth 5.54 billion in the previous week.
Elliott wave has different degrees. Such degrees represent periods of time ranging from one day to one hundred years. Elliot wave has 5 different waves for the price to go up and 3 waves for the price to go down. In the five waves that are going up, three of the growth and 2 of the correction can be seen. In this, 1, 3, 5 are for increase and 2 and 4 are for correction. The correction of wave 5 is wave A. Wave A, B, C indicate that the price and the indicator will go down.
If we look at Nepal's stock market from the last low point, it seems that a new bull has started since the 1960 point. Wave 1 can be from this point to 3000. After that, the current correction wave 2 is more likely to happen. Because the current correction has fallen to about 61 percent, i.e. below 2500, it is almost certain that this is the second wave.
Now the bull that starts after Dashain and Tihar can end only after the third wave reaches about 4200. After the correction in the fourth wave, the current bull's journey can be up to 2.61 percent of Fibonacci, i.e. from 5200 to 5400. Which is further confirmed by the cycle created by the current wave 1. If the current market goes above 2828 points, it will be more certain.
Looking at the market on a weekly basis based on the Bollinger band, it seems that the market, which has been falling for 6 consecutive weeks, has taken support in the middle band for 2 consecutive weeks before Dasain. On a weekly basis, Viaris has become a crossover in Macdi. RSI has returned from the neutral zone of 50. Overall, looking at all the three indicators, it seems that the market has taken strong support in the middle band of Bollinger ie 2440 points.
Resistance to increase
Resistance 3 – 3183
Resistance 2 – 3021
Resistance 1– 2765
Pivot Point: 2603

Fall support
Support 2– 2186
Support 3 –1929
Looking at the Elliott Wave, it seems that the market has completed the second wave before Dashain and is now moving into the third wave. If the market stays above 2860 points in the next trade, it can be assumed that the market has taken a bullish trend again. Judging from the candle stick, the market has made a tweezer bottom in recent weeks. If the market takes an up trend with transactions above 10 billion in the coming days, it can set a journey from 5200 to 5400 when the fifth wave ends in one and a half years.


